Linear regression is one of the simplest Machine learning algorithms, and possibly the most widely used as well.
What is Linear Regression? Linear regression is a statistical method to model the relationship a dependent variable (outcome) and one or more independent variables (the predictors). It assumes that the relationship is linear between variables, so as the predictor variables change they also change the outcome variables at the same rate.
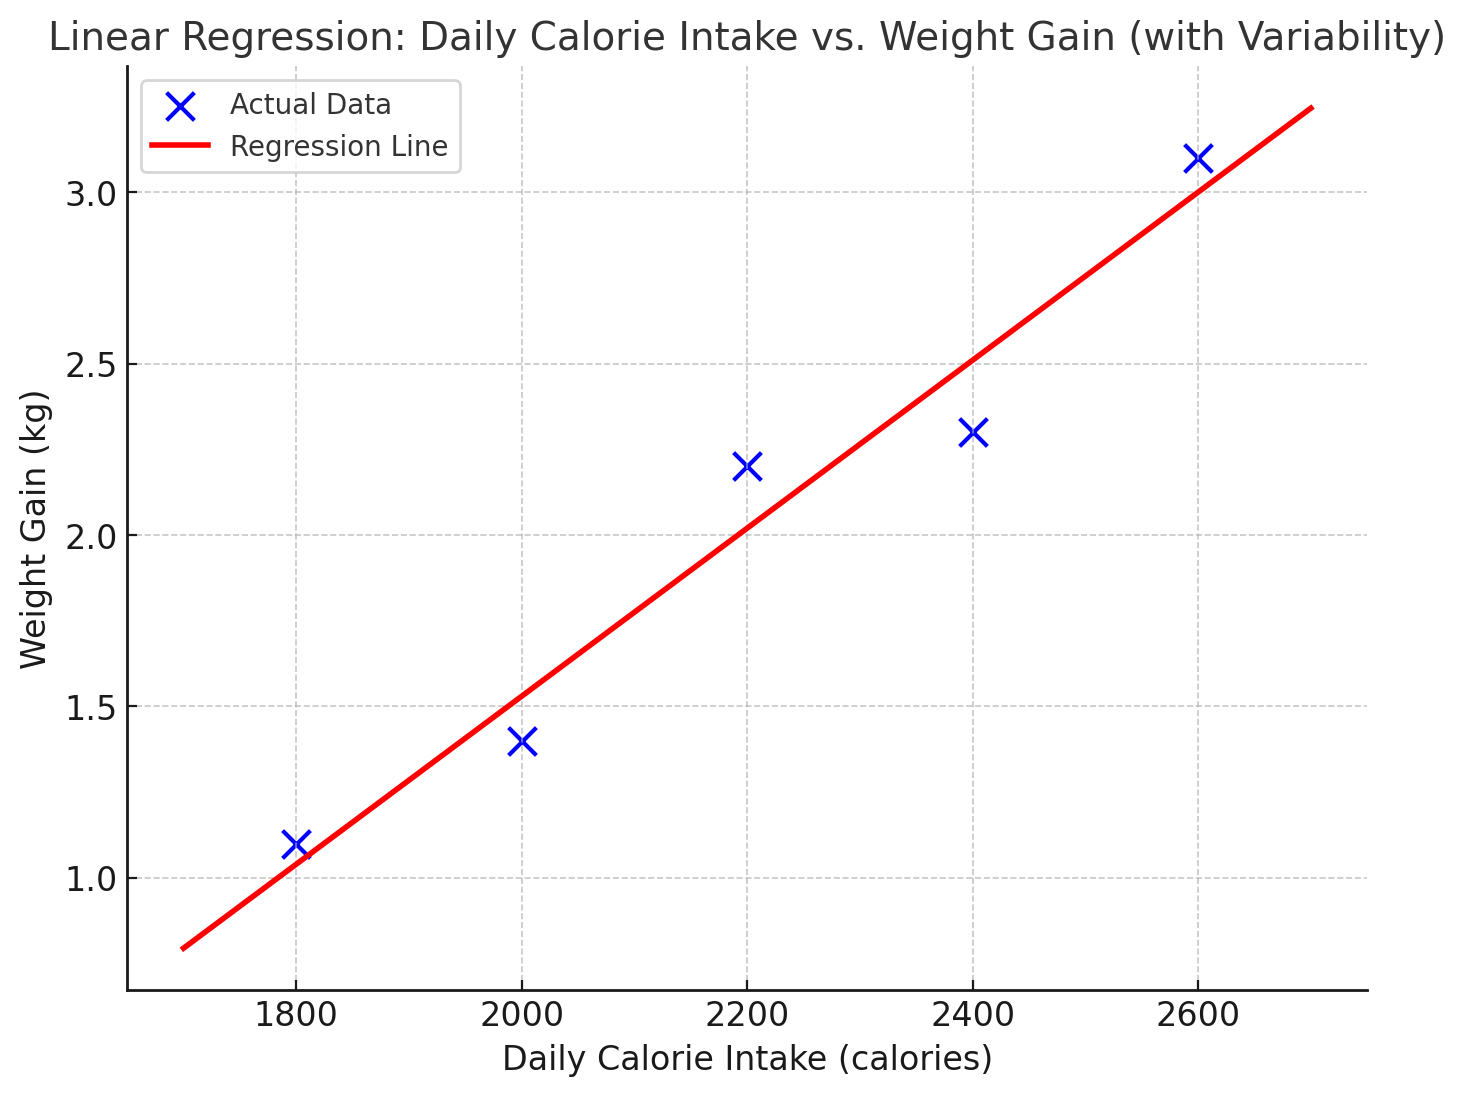
See the plot below, where the body weight is plotted as a function of calories intake. As the calories increase, the weight also goes up.
The line does not try to flow through every data point, rather generalizes such that the overall error across all points is minimized.
Mathematically, we can also represent this as following equation:
y = mx + b
where y is the weight gain,
x is the daily input calories,
m is the rate at which weight increases for every unit increase in calorie (slope)
b is referred to as bias variable, or base weight gain when calorie intake is zero- so this constant has to be added.
What type of problems lend itself well to this technique?
This technique is ideal for predicting continuous numerical values based on one or more independent variables, such as the example above.
Forecasting monthly sales based on previous month sales and marketing investment can be another example where this method can identify trends over time to make forecasts.
While this works for simple linear relationships, it doesn’t work so well in curved non-linear relationships, data with too many outliers, or if the variability of dependent variables changes as the value of independent predictor variables change beyond a threshold value. The last phenomenon is called “heteroscedasticity” - in our example as the calorie intake crosses threshold of say 2500 per day, some individuals may gain weight much faster and others much slower- thus rendering linear regression insufficient in those ranges.
Optimization Techniques: MAE vs MSE
Mean Squared Error(MSE) and Mean Absolute Error(MAE) are used to determine the loss when fitting the line to data.
MSE refers to the average of the squared differences between actual and predicted values, penalizing larger errors more.
MAE refers to the average of the absolute differences between actual and predicted values, treating all errors equally.
For our example here, MAE is better because it is less sensitive to outliers, which is important if some individuals have unusually high or low weight changes that could skew the MSE.
In contrast, in financial forecasting, large errors can have a significant impact on investment decisions. MSE’s emphasis on larger errors can be beneficial in this context, as it encourages the model to minimize the risk of large losses.
So you will need to consider the trade-off between fitting majority of the data and accomodating outliers.
Energy considerations: Hyperparameters
Hyperparameters are settings that you set before model starts training. Learning rate, epochs, and batch-size are the key hyperparameters to set. The model trains by iteratively adjusting the weights and biases with the objective of minimizing the MSE or MAE loss. And these hyperparameters are the levers it uses.
Learning rate is the size of steps the model takes to adjust its weights. If this rate is very small then the model will take lot of steps to converse. At the same time, if it is too big then the model will fluctuate above and below the optimum and may never converge. Both of these will lead to high energy use. So careful choice of learning rate is very important.
Epoch means that the model has processed every example in training set once.
Batch size refers to the number of examnples a model processes before updating weights.
Stochastic gradient descent(SGD) uses only 1 example or batch size of 1 per iteration. Full-batch gradient descent uses all the examples per iteration. While SGD may be more accurate it will also have more energy use. Whereas full-batch will be least compute intensive with compromise on accuracy. A middle path is mini-batch SGD that uses an optimal natch size greater than 1 and less then the total examples, such that you get reasonable accuracy without expending too much energy.
Responsible AI risks in Linear Regression
Linear regression, while seemingly simple, can pose responsible AI risks. Bias in the training data can lead to discriminatory outcomes, as the model may perpetuate or amplify existing societal inequalities. Additionally, overfitting can create a model that performs well on training data but poorly in real-world scenarios, potentially leading to inaccurate or unfair predictions. Finally, the interpretability of linear regression, while generally good, can still be misused or misunderstood, leading to misplaced trust in its outputs, especially when used for high-stakes decisions.
In summary
Linear regression is a foundational technique for modeling relationships and making predictions in data. With careful tuning and responsible practices, it can provide accurate insights while minimizing bias and energy use.