In my previous post about building Generative text apps, I mentioned that I would be sharing a new post on how LLM can be used in Data analytic scenarios. So here in this post I will share my experiment with the exciting library Pandas AI that lets you do conversational data science. Let’s see how this can be a game changer for Data engineers and analysts.
Panda AI is an open source project that extends the capabilities of the popular Pandas by bringing in Generative AI capabilities. Users can interact with their dataframes using natural language prompts. This saves a lot of time in writing complex queries, and makes the data analyst experience very intiutive and frictionless.
Here are the key steps to enabling this magic.
- Ingest the data using the familiar Pandas library as a Dataframe.
- Instantiate a LLM like OpenAI GPT model and hook it upto Pandas AI.
- Submit user prompt or questions about the uploaded data.
- LLM processes the requests and generates Python code to execute on input data with intent of addressing above user query.
- System executes the Python code and returns result.
- The results are converted into a conversational format for simple understanding and returned to user.
First I import the pandas libraries.
import pandas as pd
from pandasai import PandasAI
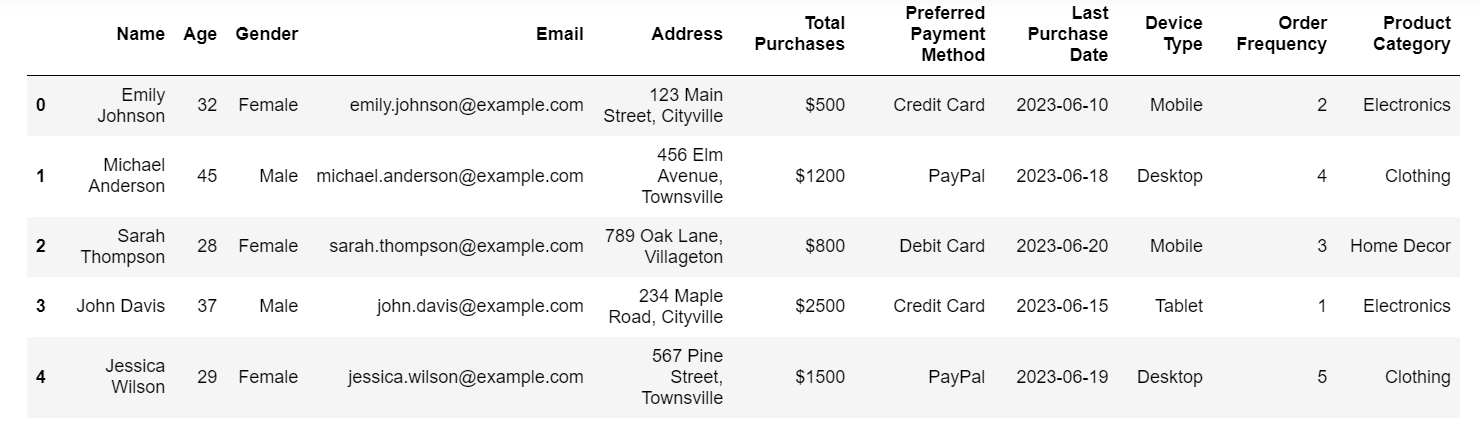
Next I read shopper data in CSV format that I generated synthetically from OpenAI GPT model. So Data generation is a useful capability to leverage, even for areas like testing.
shopperDF = pd.read_csv('data.csv')
shopperDF.head()
Then I hookup the Pandas AI with openai LLM.
from pandasai.llm.openai import OpenAI
llm = OpenAI()
pandas_ai = PandasAI(llm, conversational=True, verbose=False)
It’s a good idea to clear the cache of previous response.
pandas_ai.clear_cache()
The first query is a simple one to view the top spender details across categories.
prompt="Display the top spenders along with their names, age and gender within each prdouct category"
result = pandas_ai(shopperDF, prompt)
print(result)
Answer to the query is shown below, and it tallies.
The top spenders for each product category, along with their names, age, and gender are: Matthew Baker (30 years old, male) for Clothing, Daniel White (35 years old, male) for Electronics, and Joseph Anderson (44 years old, male) for Home Decor. They have spent a total of $3000, $3500, and $2000 respectively in their respective categories.
Next, I ask for top spenders in select categories.
prompt= "who are the big spenders in clothing and electronics?"
result2 = pandas_ai(shopperDF, prompt)
print(result2)
The result looks good again.
According to the data, the big spenders in clothing and electronics are Samuel Turner and Daniel White, both spending a total of 3500. Andrew Cooper and Benjamin Roberts come in second with a total of 3200, followed by Noah Campbell with 3100.
Following queries add more complexity gradually, and Pandas AI fares very well!
prompt="Summarize the purchases of top shoppers in electronics category"
result3 = pandas_ai(shopperDF, prompt)
print(result3)
The top shoppers in the electronics category are Daniel White and Samuel Turner, who both made purchases totaling $3500. Andrew Cooper and Benjamin Roberts also spent big, with $3200 in purchases each. Noah Campbell rounds out the list with $3100 in total purchases.
prompt="How does the average spend compare across device types? "
result4 = pandas_ai(shopperDF, prompt)
print(result4)
On average, people spend $1,526.67 on desktops, $1,281.25 on mobile devices, and $2,450 on tablets when making purchases.
prompt="How does the average spend compare across categories with and without including home decor? "
result4 = pandas_ai(shopperDF, prompt)
print(result4)
If we include home decor, the average spend for clothing is $1742.86, electronics is $1953.33, and home decor is $1183.33. However, if we exclude home decor, the average spend for clothing and electronics remains the same.
Next comes the most interesting part. You can generate visualizations from data by just prompting the request.
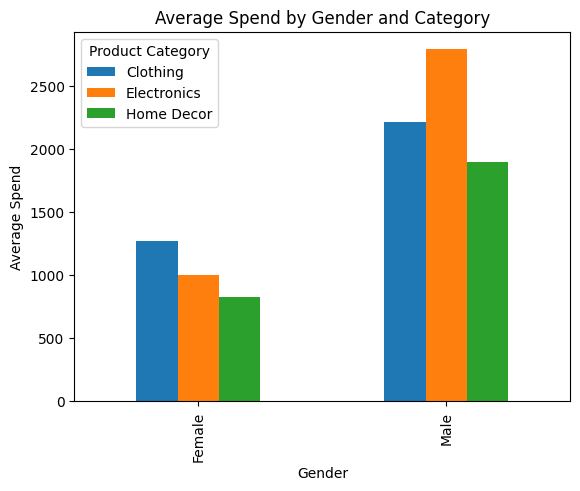
prompt="Plot the bar graph that displays the average spend for males and females by category"
pandas_ai( shopperDF, prompt)
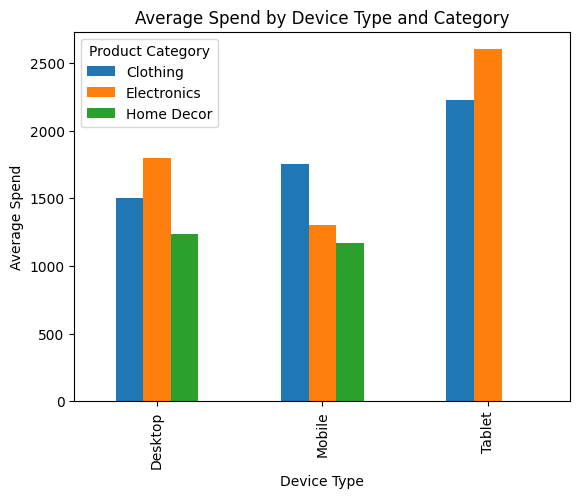
prompt="Plot the bar graph that displays the average spend for customer by device type and by category"
pandas_ai( shopperDF, prompt)
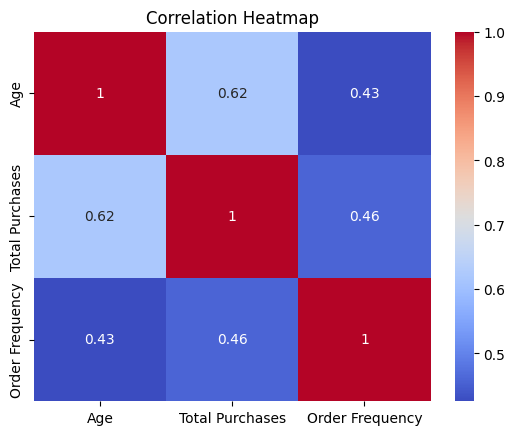
Next I ask Pandas AI to generate correlation heatmap using its API end point.
pandas_ai.plot_correlation_heatmap(shopperDF)
So, as we can see this really is a game changer as you get a conversational way to query and visualize the structured data. In addition, you could also augment the data, add more columns, identify useful Machine learning features, impute missing values, and even cleanup the data using the power of LLMs with Pandas AI.
Credits:
Pandas AI Pandas AI Documentation site.